Economics and Profitability
Vertical Farm Entrants: Judge by Where They Profit, Not Count

Before you reach to search “vertical farm entrants rising,” stop for a moment. What you really want to confirm with that number isn’t the company count. What you want to confirm is whether there’s still room for you to get in. But a large number of entrants can back up the case that the field is promising, and it can equally back up the case that “it’s already too late.” The same number reads as both a tailwind and a sign you’ve already missed the boat. So before you count, there’s something to settle first. In that market, where is the money being made — and where could you go and take some for yourself?
You see vertical farm entrants more clearly when you sort them by revenue structure
“Another big player enters.” “That company pulls out too.” Headlines like these run through the vertical farm news on a regular basis. You probably get plenty of chances to look over the lineup of entrants.
At times like that, you can’t help thinking, “if this many are gathering, it must be promising.” But look closely at the lineup and you notice the makeup is all over the place. There are manufacturing-sector companies that originally did semiconductors or electronics; there are players coming from foodservice and distribution; and there are newer ones like agritech ventures. At first you take it simply: “all kinds of industries are paying attention, impressive.” But then it strikes you: these aren’t actually competing in the same ring, are they? For the manufacturing-sector companies, whether they want to sell equipment and plants or grow and sell vegetables themselves — where they make money is probably different. Foodservice players, for the most part, presumably do it on the premise of using the produce in their own stores. Once you think it through, even if you lump them together and count “X entrant companies,” aren’t you just mixing in people who are actually doing completely different things? And reading a high company count as crowding — that’s off too, isn’t it?
This unease is the way in. Counted in a single line, it looks crowded. But in reality, where each company makes its revenue is utterly different from one to the next. So rather than the company count, I’ll look at them rearranged by “where they make money.”
The revenue exit — that is, where the money is recovered — sorts, in my own rough way, into about three groups you can see through. This isn’t an academic classification; it’s the breakdown that clicked for me as I watched the lineup. The first is the layer that earns by selling equipment and plants. It’s common among the manufacturing sector, and for them, vegetables are more like a demonstration meant to show off what their equipment can do. What they want to sell is the apparatus, not the vegetables themselves — at least, those are the companies that catch the eye. The second is the production-and-sales layer that sells the vegetables it grows to the outside. Agritech ventures and specialist players sit here, and they’re truly competing on “the price of vegetables.” The third is the internal-consumption layer, like foodservice and distribution, that grows for its own use. These aren’t even selling vegetables against each other in the market.
These three, even under the same “we do vertical farms” banner, differ completely in who they fight and in what makes a profit possible. So a high company count doesn’t necessarily mean a red ocean. What matters more is which layers, and how many of them, are clustered in the channel you’re aiming for. If production-and-sales players are fighting over the same shelf at the supermarket storefront, then that shelf really is crowded. But manufacturing-sector players who want to sell equipment don’t compete much over that shelf. Conversely, there are areas where competition over equipment inquiries runs hot. In other words, the “X entrants” number tells you almost nothing about how crowded the channel you’re trying to enter actually is. Sort the lineup by revenue structure first, then look at which layers are coming into the channel where you stand. Only then does the “open band” that no one has yet packed start to come into view.
Part of this reading is backed by industry research. Through the 2010s, new entrants from outside industries such as manufacturing, semiconductors, and electronics came one after another, and facilities scaled up at the same time — several market reports describe exactly this (see 1, 2). But all that can be said there is that “entrants increased.” Whether those companies are turning a profit in agriculture is something you need to view separately. Alongside this, one study conceptually frames vertical farming not as a replacement for open-field agriculture but as a different mode of production for opening new markets beyond the constraints of location (see 3). That’s the kind of footing for the breakdown that, even under the same “we do agriculture” banner, the exit differs.
An open band is decided by how well it’s protected by the neighboring layer
The layer that wants to sell equipment, and the layer fighting to sell vegetables on the shelf. Until now, these two utterly separate things were dissolved into a single company count. Sort them into three by exit, and the scenery that had looked blended into one number suddenly comes into focus.

Here, isn’t there one thing that nags at you? It’s whether those three layers stay in the same place forever. For example, a manufacturing-sector player that wanted to sell equipment notices that “the vegetables we grew as a demonstration sell better than expected” and gradually moves out toward production and sales. That kind of shift seems entirely likely to happen. If so, the “open band” you see now may, before long, get filled as the neighboring layer seeps in. You can’t use the breakdown you first drew as if it were fixed. That being the case, when you look at an open band, you’d do well to look not only at the current lineup but also at “which layer wants to move in which direction.”
That said, the seepage seems to have a directional bias. Not everyone can move anywhere; moving out to the spot next to the exit where you already make money is the least strained path. For the manufacturing sector to seep into production and sales looks, at first glance, easy to happen. The equipment is already in hand. But the thing to watch here is that it can look light, as if “all that’s left is to learn how to sell.” As far as I’ve seen over and over on the ground, that wall of learning to “sell” is the highest one of all. Securing a fixed buyer is far harder than switching to being the one who grows. Conversely, for a production-and-sales player to turn into the side that sells equipment is, while not impossible, more of a slog than it looks. I was originally on the side selling PFAL know-how and startup support, so I know: designing know-how and systems as a “product” and looking after the buyer’s site until it runs is an entirely different muscle from growing vegetables. You don’t have to manufacture the full apparatus in-house and shoulder the maintenance; there is a path of selling operational know-how lightly, in the form of a solution or a license. But making it last as a business is a different trade, not so easy that you can do it on the side while growing vegetables. The internal-consumption layer, say foodservice, moving into outside sales is likewise conditional — only once there’s surplus beyond what it can use up itself.
In other words, seepage tends to head “next to the assets it already holds” — this is inference, to be sure, but viewing it this way rarely steers you wrong. So I look at an open band in two stages. First, who is in that channel now. Next, whether the neighboring layer has the assets and the motive to seep in. Viewed that way, what you should really aim for is “a band that’s open now and that the neighboring layer also can’t easily seep into.” An open band a neighbor can come and fill right away is an apparent blank, and it won’t hold for long. Conversely, an open band protected by a layer that lacks anywhere near the assets to seep in looks usable as your own spot for a while. An open band isn’t a still image; I think of it as something to evaluate by “how well it’s protected against the pressure from next door.”
A point close to this reading — that “seepage tends to head next to the assets” — appears in research comparing how companies enter agriculture too. Entry comes in two forms, a direct-management approach where you set up your own farm and an alliance approach where you partner with existing growers, and which one you take changes the speed of securing lots, how risk is borne, and how the investment is recovered, as the study lays out. In particular, when a distributor enters via an alliance, the target return it can expect from distribution is thin, around 1%, and recovering an investment commensurate with comprehensive support is structurally difficult, the study notes (see 4). This research doesn’t argue the direction of seepage itself, but as a line of reasoning that the assets in hand and the prospect of recovery constrain which band you can move out into, it resonates.
A wave of exits doesn’t mean the market is over
So far this has been about the side entering — that is, the layer seeping in. The same breakdown works just as well for the side leaving. A common interpretation you hear is, “exits keep coming, so this market is finished.” It’s the flip side of reading a large number of entrants as proof of promise: reading a large number of exits as decline. But the lineup leaving must, again, have its own bias.
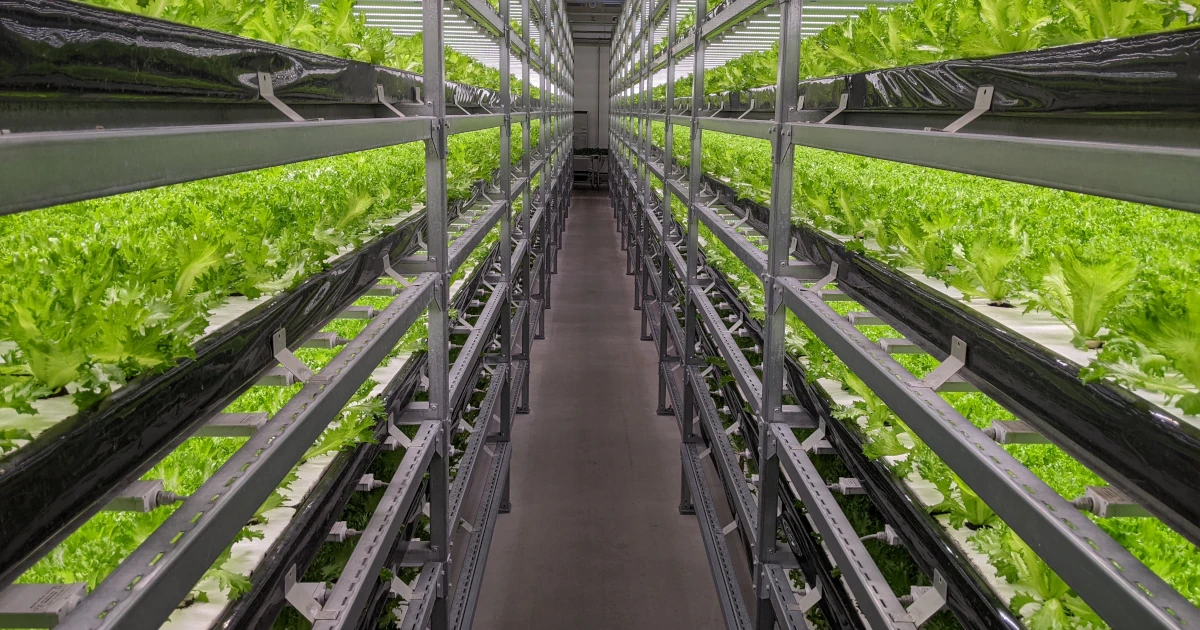
The story of exits can be read with exactly the same breakdown as entries. Just counting “X exit companies” carries little meaning; what you want to see is which layer left. But here’s the hard part: which layer a departing company belonged to is hard to tell from the outside. For instance, the exit of a manufacturing-sector player that wanted to sell equipment (the equipment-sales layer) stands out. For them the factory is a stage for pitching their apparatus, and if the equipment inquiries dry up, or the demands of their core business no longer allow it, they fold the whole demonstration — there will be cases like that. But whether that’s “merely finishing the demonstration” or “running out of steam because the vegetables didn’t sell” often can’t be told just by watching from the outside. The exit of a production-and-sales player, on the other hand, carries heavy meaning. They were truly competing on the price of vegetables, so if that layer leaves in a bunch, it’s a strong sign that the channel really isn’t paying. An internal-consumption player folding its factory is a verdict from real demand — that using its own produce cost more — and this, too, can’t be taken lightly. So “a wave of exits doesn’t necessarily mean the market is over” — that much can be said. But which layer left is hard to tell from the outside, and there’s no public data tallied by layer either. So you also can’t just assume that “the equipment layer that finished its demonstration pulled out on schedule.” What you should truly watch for is when, in the channel you’re aiming at, the production-and-sales layer that was fighting on the price of vegetables leaves. Yet whether that’s happening is itself hard to declare from outward appearances alone.
It’s better not to lump exits and losses together as “the market is over” — and from the numbers side, too, this is backed up to some degree. But the very “X% in the red” figure that comes up here calls for care about the population it covers. For example, an industry column taking up subsidy-program vertical farms reported “75% in the red despite 50 billion yen in subsidies” (see 5). But this is an opinion column, not a peer-reviewed paper, and its population is skewed toward the specific layer riding on subsidy programs. An industry-magazine article that widened the scope to large-scale protected cultivation puts roughly 49% of all types combined in the red, in a single-year snapshot of 2016 (see 6), but the figure swings from year to year. What looks more robust is the breakdown by type: in a Ministry of Economy, Trade and Industry survey, about 56% of PFAL operations were in the red, a majority (see 7). The world I’ve worked in on the ground is this one too, PFAL and leafy greens, and it fits my gut sense that this is the toughest type for profitability. In short, it isn’t simple enough to flatly declare “75% of vertical farms are in the red”; the figure moves depending on which type and which population you looked at. Even so, it’s certain that this is a domain where losses and exits routinely happen, and that’s exactly why it’s worth trying to tell which layer a departing company belonged to — even if that’s hard to tell from the outside. Incidentally, narrowing to vertical farms specifically, one estimate holds that without continued capital injection roughly 85% hit a wall within a few years of founding (see 8), which actually suggests that the larger the scale the more it can run out of steam on profitability, and is material for cautioning against casually reading an exit as “folding the demonstration.”
You can draw how crowded your band is in five columns
Even if the logic makes sense, the moment you try to actually get to work you hit a tough spot. You can find out the entrants’ names by looking them up. But can you really see from the outside which of the three layers a company falls into, and how many of them are clustered in which channel? Press releases often say nothing more than “entering vertical farming.” To make a list of how crowded the band you’re aiming at is, exactly which items should you line up and compare? Let me lay that out here.
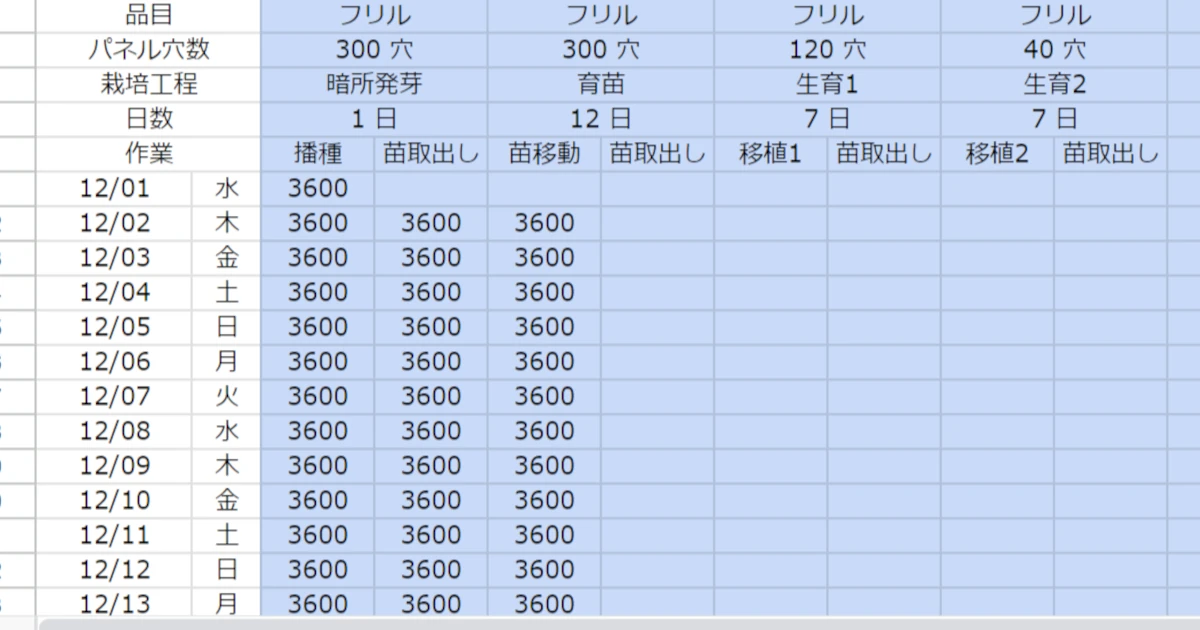
You can’t classify perfectly from the outside. But you don’t need to be perfect either. Line up items you can fill in yourself, even roughly, and the layers and open bands surface well enough. To make it a single table, line companies up vertically and create the following five columns horizontally.
- Core business (industry of origin): manufacturing, agriculture/food, or foodservice/distribution. This serves directly as a hint to “what kind of assets they hold,” and becomes the starting point for predicting the direction of seepage.
- Way of earning (source of revenue): apparatus and plants, the vegetables themselves, or for in-house use. This is the column for telling apart the three layers from the previous chapter (equipment sales, production and sales, internal consumption). Even when a press release says nothing but “entering,” the vocabulary gives you a rough gauge: lots of words like “demonstration,” “solution,” and “equipment” lean toward the equipment layer; “shipment,” “buyers,” and “brand” lean toward the production-and-sales layer. But this is only a gauge. What they want to push forward in their PR and where they actually make money can even be the opposite. The equipment crowd can flashily tout brand vegetables, and a production venture can chant “solution” over and over. What’s more, it’s not rare for a single company to straddle all three layers at once, so it’s safest to use the vocabulary only as a clue and not to declare anything.
- Sales channel (the vegetables’ exit): the supermarket shelf, foodservice and ready-to-eat, own stores and in-house use, or no mention yet. This is the column that decides whether a company collides directly with the band where you stand.
- Crop: centered on lettuce and leafy greens, or something else. Even with the same channel, if the crop is offset you don’t collide directly, even on the same shelf. It lets you read crowding one notch finer.
- Seriousness and scale: a single standalone demonstration plant, or multiple sites and mass production on the banner? If it stops at one demonstration, you can take both the seeping-in pressure and the exit risk lightly.
The knack is to leave blanks and “unknown” as they are. Don’t force them filled. Once the table is filled in, first divide by “way of earning,” then by “sales channel” pull out only the rows that match your own band. If several production-and-sales players are lined up there, you can read it as a band that’s truly crowded; if it’s all equipment layer and unknowns, a band that’s less crowded than it looks.
This much is a table for lining up other companies, but at the end you add one row for yourself. In the same five columns, write in your own sales channel, crop, and scale, plus region (where you sell) and operating capability (how well you can stabilize yield and uptime). On that basis, avoid the crowded bands and look at whether you can overlay yourself onto an open band in a column where your strengths tell. If you have the local foodservice route locked down, aim your regional strength where that channel’s band is still thin. If you have long-accumulated cultivation-operations know-how, that operating capability translates into unit price more readily in a small-lot, multi-crop band where human judgment counts than in a large-scale band premised on full automation. Setting a tentative line of differentiation means precisely this: overlaying your strong column onto a band of low competitive density.
That profitability splits by crop and channel — several studies point the same way. The commercial crops for vertical farming are, for now, nearly limited to leafy greens, herbs, and berries, while staples like rice and wheat don’t hold up cost-wise — this framing has been shown repeatedly (see 9, 10). A survey of commercial urban agriculture lists profitability, financing, and production cost as the biggest management challenges (see 11). For example, an estimate targeting urban microfarms in London found the probability of profitability higher once into operation than at the startup stage, around 65% in the operating stage versus around 29% at startup (see 12). But this estimate targeted soil-based, organic, small-scale urban gardens, a completely different type from closed LED vertical farms, and it needs to be noted as a rough gauge with large variance. The use is to borrow, knowing the type difference, only the direction that “results change by channel and price band.” There’s also the point that, skewed toward leafy greens, herbs, and microgreens and sold at a premium price band, the direct contribution to access for low-income groups and to food security is limited (see 13, 14). Results clearly change by channel and price band — this point is continuous with the thinking behind the five-column table.
The reason to keep scale as a column is backed by construction-cost research too. Economies of scale operate in vertical farm construction costs, and a single-model estimate using certain facility data puts the scale elasticity at -0.17, meaning that when scale grows 100-fold the per-unit construction cost falls by about 55% (see 15). The same study also shows that the scale at which profitability is reached differs completely by crop. For lettuce the break-even point is small, around 38 square meters, whereas for strawberries the commercially viable scale is, with current technology, larger by orders of magnitude and estimated to be unrealistic (see 15). Since it’s a single-model estimate you can’t swallow the figures themselves whole, but the direction is worth holding onto — even under the same “vertical farm,” the scale at which profitability is reached changes greatly depending on the crop you aim for.
What this list can and can’t do
Finally, let me draw one line. What this list can do is read which revenue-structure layers, and how many of them, are coming into the band you’re about to stand in — that is, “crowding and open bands.” Based on that reading, you tentatively form a hypothesis or two about which axis to shift on to differentiate. That’s as far as this list’s job goes.
What it can’t do is judge the merits of individual companies or evaluate them as investments. “Is that company a buy?” “Is the listed one over there better?” These questions look like they’re about the lineup in the list, but they actually belong to a world with a different yardstick. What this list lines up is positional information, “which band the company is in,” not a story of capability or finances, “whether the company is doing well there.” Even lined up in the same production-and-sales layer, a company running in the black and a company barely scraping by on capital raises look like the same single row on this list. So while you can say “this band is crowded,” you can’t get as far as “therefore this company is strong or weak” or “it’s a buy as a stock” from this list. That’s a wholly separate examination, reading into earnings, finances, and the substance of management on their own.
To put it in order: what this list answers is “where do I stand, and how do I differentiate.” What it doesn’t answer is “which company is superior, and is it attractive as an investment target.” The former is a positioning question with your own business as the subject; the latter is an evaluation question with other companies as the subject — change the subject and the yardstick you use changes too.
So this five-column table is best used as a workbench for deciding where you stand, nothing more. Try to repurpose it for investment decisions or rating other companies and you’ll ask more of the table than its precision allows. Read how crowded your band is, then tentatively set a line of differentiation in an open band — used strictly for that purpose, this list will serve you properly.