Farm Operations Management
Nutrient Solution Management: EC and pH Shift by Crop and Stage
Articles for Farm Operations Managers
Every morning you put the meter on it, and both EC and pH are right on target. The numbers in the daily report line up neatly. And yet, when someone asks “how much is this management actually doing for our gross margin?”, the logs are all there but no answer comes out. The numbers being right and them mattering to the profit are, somewhere along the way, moving separately. There are plenty of operations where just hitting the targets is nearly enough, but when trouble shows up that the targets cannot explain, some amount of money can be quietly slipping into that gap every year.
The numbers are green, yet the marketable yield drops
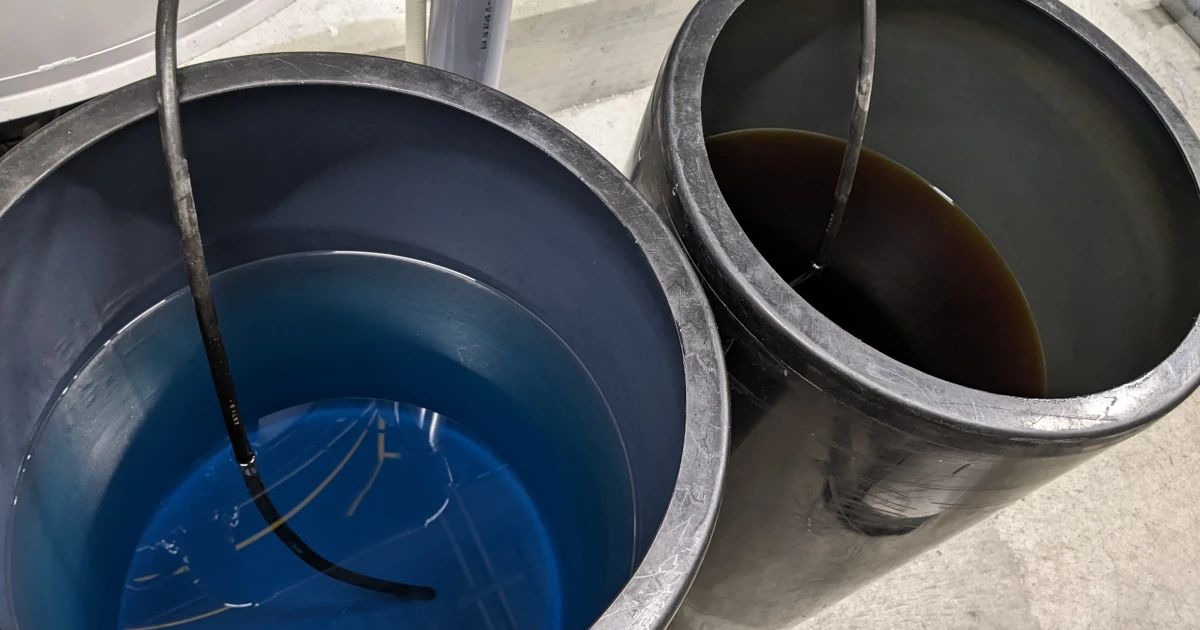
You line up the three——EC, pH, and DO——but what you are actually watching is usually EC and pH, with DO always pushed to the back. Sound familiar? The tricky part is that the trouble never shows up wearing a face you would recognize. Both EC and pH are sitting on target, and yet something is off. That is the form it comes in. Looking back later, that period was always one where the water temperature had climbed, or the roots had grown dense, and the DO had probably dropped. EC and pH are “numbers you hit,” so you adjust them every day. But DO is not a number you steer toward a target each day; it is a number that comes out as a result of the conditions. Because you could measure it but had no idea what to do about it, you left it alone the whole time. Put that way, the order may have been backwards. EC and pH, the ones you dutifully hit every day, were the obedient kind where “hit them and they hold,” and the one actually swinging the marketable yield was the DO you were ignoring. ——Though even that “hit them and they hold” is not as obedient as it looks, which I will get to later. You watched only the numbers that are easy to measure and easy to adjust, and looked away from the number that comes out as a result. Sound familiar?
DO is not a number you hit, it is a number you watch
DO is less an “untouchable number” than a precondition that sets how well the numbers you can touch will work. Frame it that way and it falls into place. EC and pH only mean something once the roots can actually take up the nutrients and ions. That uptake runs on root respiration, and respiration needs oxygen. So when DO drops, no matter how perfectly you hit your EC and pH targets, the roots cannot actually take it up. The board is set, but the pieces will not move. When DO leaks away, your EC and pH adjustments lose their bite. In order, DO sits one rung above EC and pH. There is a logic to why it gets left alone, too. DO is not something you steer toward a target each day like EC and pH; it is a number that comes out as a result of conditions——water temperature, root mass, flow rate, aeration. And what you do to move DO——the aeration method, adjusting the water temperature——is usually decided on the equipment side, not a knob you can twist day to day on the floor. So in most situations, what you can do about DO is less to operate the value itself than to check whether it is dropping and to read the slope toward deterioration early. This is where it differs in kind from EC and pH: rather than something you pick a target value for and steer toward each day, it is better thought of as something you watch to make sure it has not fallen below a set level. If it chronically drops below the floor, that is not something you claw back with daily adjustments; it becomes a higher-level question of what to do with the equipment around aeration and water temperature. And what is worth remembering is the fact that during the trouble, EC and pH looked right on target. That is not grounds for “so the nutrient solution is fine.” If anything it is the reverse: when DO leaks away and uptake slows, EC and pH look stable because the amount that goes unconsumed stays put. Those neatly settled numbers may be the flip side of the fact that they are not being used.
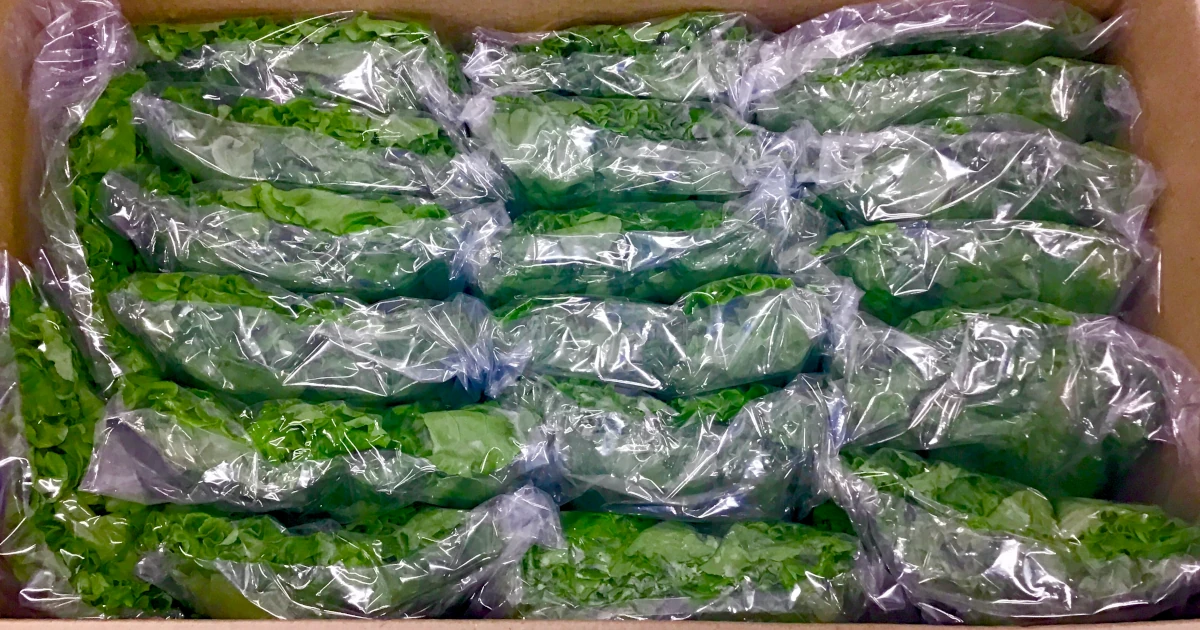
When oxygen is short, the roots cannot use the materials. Flip that around, and you can grasp the same picture from the size of the gain when you add oxygen. In one experiment, lettuce grown with oxygen dissolved into the nutrient solution far beyond saturation reached roughly twice the leaf area compared with a plot simply aerated with ordinary room air. (see 1) But that was a result under extreme conditions——low temperature, a single trial——and it does not mean you get double in normal operation. Even so, the direction is visible: growth can move this much depending on the oxygen reaching the roots. What actually matters on the floor is the lower-bound side. Across the range I have run with PFAL leafy greens, I have used as one safe-side rule of thumb not letting dissolved oxygen fall below 5 mg/L, and keeping it around 8 mg/L if possible. There is a reported case for fruiting vegetables, NFT tomato, where stress symptoms and stalled growth appear once dissolved oxygen drops below 5 mg/L. (see 2) But that is a second-hand citation drawn from an aquaponics-coupled recirculating system, phrased loosely as “can appear,” and how it bites changes with the method and the capacity of the nutrient reservoir. The same review also cites examples where a larger tank water volume tolerates low DO, and reports where even 1 to 3 mg/L did not cause severe harm. (see 2) So 5 mg/L is not an absolute threshold that applies everywhere; it is set as a lower-bound rule of thumb, to keep from “falling below this.” Rather than higher being better, it is better thought of as a number you watch to keep it from falling below a set level.
So when we say DO is a number for reading the slope toward deterioration, what does “reading the slope” actually look like on the floor? Do you log the DO value itself, or do you watch the conditions instead——how many degrees the water temperature climbed, how much the roots have grown? Or do you still measure DO, and use it as an early sign when it starts to drop? The answer is, you do both. You measure DO. But you do not read it as “what is it today.” You read it as the difference: has it come down since last time? At the same time you watch the conditions too. This is a two-tier setup. Why are the conditions alone not enough? Which of water temperature, root mass, and flow rate matters differs by the equipment, and even under the same conditions how it bites shifts with the season and the growth stage. Watching the conditions is for getting a bearing on “what is pulling the DO down”; it is no use for detecting the deterioration itself. Conversely, watching DO alone means that the moment you find it has dropped, “so where is the cause” is not in hand. So you split the roles. DO for detecting the deterioration, conditions for isolating its cause. Though even once you know the cause, whether you can actually move the aeration or water temperature depends on the equipment, and in many situations all you can do on the floor is check first. But DO itself is also a number that comes out as a result, so by the time it has dropped, the uptake has already started to dull. The real leading indicator is the movement on the condition side: the water temperature beginning to climb, the roots growing dense. In order, the change in conditions comes first, the drop in DO backs it up, and last it shows up as poor growth. DO sits in the middle of this, the confirmation that checks whether the hunch on the condition side is real. So for logging, rather than leaving the absolute DO value as a single point, it is better to log water temperature and DO as a set. When the water temperature rises, the ceiling on how much oxygen can dissolve in water itself drops, so for the same DO reading, a drop at high water temperature leaves no margin. Lining up water temperature, the condition, next to DO, the result, lets you read whether a “drop” is a routine drop or the kind that will leak away if you leave it. Stop steering one number toward a target, and read the slope as a pair of condition and result. That is it.
How you get that oxygen into the water is mostly decided at the stage you build the equipment, not a day-to-day operation. What is efficient at a large facility is falling-water aeration, dropping water from a height to take in air. Oxygen dissolves in proportion to the drop height and the circulation volume, and it is easy to keep the extra electricity down, so it suits operations premised on running long. If even falling water is not enough for the design, you add aeration (diffuser type) that sends air directly into the water. You earn the baseline DO with falling-water aeration and make up the shortfall with the diffuser type——that is the way it is put together. This is the split I have actually seen on the PFAL leafy-green floor; I have not seen whether it is the same for greenhouses or fruiting-vegetable recirculating systems. Either way, once the equipment is set, what you can do day to day on the floor centers on checking whether that configuration is falling below the floor.
EC speaks only of the total
So can you flatly say of EC and pH that “as long as they are on target, you are safe”? Let me deal with pH first. pH is a “number you hit” alongside EC, and hitting it is itself indispensable. Most crops take up nutrients most efficiently around pH 5.5 to 6.5, and outside this range certain nutrients become hard to dissolve and the roots cannot use them. So getting it into this range is the starting point. But even when pH is sitting on target, all that answers is that the foundational condition——whether the nutrients are dissolved and in a form that reaches the roots——is within range. Whether the roots are actually taking it up right now, pH does not guarantee. And pH drifts on its own as the roots take up ions, so it is not a number you hit once and are done with; the range it moves over varies by crop and medium, so it is not something you can pin to a single correct value either. pH you “hit,” but the bite past the point of hitting is, like DO, a separate matter——let me put it that way. On top of that, EC has an “on target yet says nothing” quality in a different sense again. EC is a number that lumps the overall concentration into one. The concentrations of separate ions——nitrate, potassium, calcium, magnesium——are all added together into a single conductivity. So even when the total is on target, the ratio of the contents is not necessarily on target too. The information that EC is on target says no more than “the total is on target”; it does not guarantee the breakdown. And that breakdown drifts on its own even if you leave it. Roots do not take up ions evenly; depending on the growth stage and the crop, some are taken up well and some are left behind. For instance, in a period when potassium is taken up well, even when you top back up to the same EC with replenishment solution, while you are adding the depleted potassium to match the total, the other ions left unabsorbed gradually accumulate. The EC is the same, yet the contents drift into something different from the solution you supplied. The more you reuse the solution in a recirculating system, the more this drift piles up (in run-to-waste or greenhouses the accumulation works differently). EC looked obedient not because “hit it and it holds,” but because the drift was hidden inside the breakdown and never showed up in the single number that is EC. EC is structurally similar to DO. The look of being on target is no proof that the contents line up too. The moment you round it into a single number, the information about the breakdown is lost.
This shows up clearly in research that actually measured the ions one by one, too. When you track individual ions in a closed recirculating system, the concentrations of phosphate, sodium, and chloride do not move in step with the rise and fall of EC. Chloride in particular dropped to nearly zero in the solution from a certain point on. As long as you are watching the single number that is EC, this skew never surfaces. The paper itself concludes that because EC-based management alone misses the deficiency of specific ions, you need to go and check the ion shortfalls periodically. (see 4)
So the answer would be to measure the contents directly——but it is not that simple. In research on automated management with electrodes built in to measure each ion, nitrate and calcium could be held on target, while potassium ended up prepared about 40% more concentrated than the target because the electrode read low. (see 5) Another review reports that nitrate and potassium settle to reasonable accuracy with membrane electrodes, but calcium’s detection sensitivity falls off. (see 6) The technology to “measure down to the breakdown” is already working, but it has not yet reached the accuracy where you can lean on it as-is on the floor.
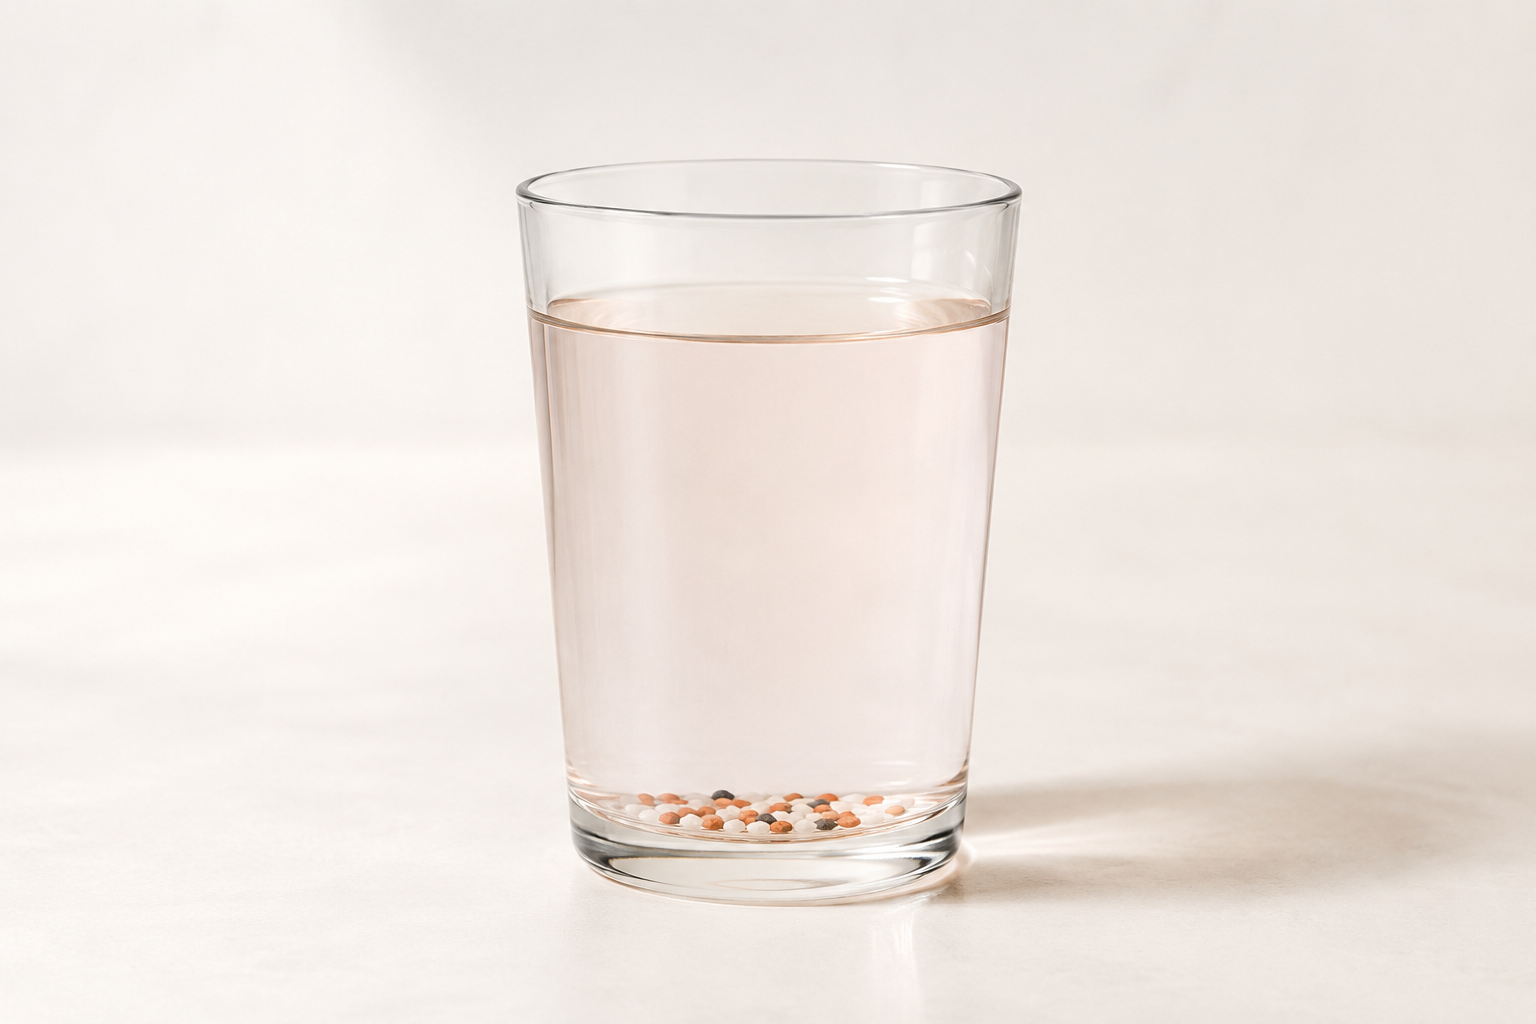
And there is an experiment that shows straight on that “EC is on target yet something is off” is not just an impression. In one experiment, lettuce grown in recirculating solution held at the target EC came in about 20 to 35% lighter in above-ground weight than a plot of freshly made-up solution each time. And the concentrations of nitrogen, phosphorus, potassium, and iron in the tissue were all lower together. EC was on target, yet the nutrient contents were short——that is the form. (see 3) But in this experiment the source water was moderately alkaline tap water, and the calcium, magnesium, and bicarbonate it contained accumulated through the recirculation, pushing up the apparent EC and masking the major nutrients. In the plots that used pure water (RO water) or dumped and remade the solution every two weeks, this drop disappears. So you cannot generalize the figure of 20 to 35% itself as “this is what always happens with recirculation.” Even so, the phenomenon itself——the breakdown drifts and growth drops——is confirmed independently in other research (4) too, from a different mechanism of skewed uptake and precipitation, and it is robust. And that difference began to show in the leaf spread roughly two weeks from transplanting. (see 3) This is a result from a specific source water and a single study, but the form——today’s numbers are normal yet the bite shows up weeks later——overlaps with the feel from the DO case.
That said, if you take this as “measure individual ions every time,” you swing too far the other way, back to fighting ease of measurement. Running individual analysis on the floor every day is heavy work. Better to keep using EC, dealt with squarely as management of the total, and on top of that hold the premise that “even when the total is on target, the breakdown can drift.” And you hold down the drift in the breakdown on the operations side. What comes into play there is how often you replace the nutrient solution. In research growing paprika (a fruiting vegetable) in a closed recirculating system, the very way potassium was taken up changed with the renewal interval of the nutrient solution, and replacing it every four weeks held down the swing in the cation-to-anion ratio. Conversely, the plot left to build up for twelve weeks had the lowest fruit yield within the closed recirculation. (see 7) But that four-week figure is a research value under fruiting-vegetable, closed-recirculation conditions, and the proper interval changes with the crop and the system. The rule of thumb I have used for leafy-green recirculating systems is, for scheduled renewal, roughly once every two to three months. Fast-growing leafy crops consume faster, so I raise the renewal frequency, and in summer microbes get active and degradation speeds up, so I move it earlier. But separate from this scheduled renewal, you need an axis of operational judgment: remake it ahead of schedule when signs appear.
| Sign | Detail |
|---|---|
| EC becoming unstable | Frequent adjustment becomes necessary, or there is unexpected variation |
| Sudden change in pH | pH returns to an abnormal value right after you adjust it, or the swing is large |
| Color or smell of the nutrient solution | Cloudiness, discoloration, or an unpleasant smell |
| Stalled growth | New shoots grow slowly, leaves are small, stems are thin |
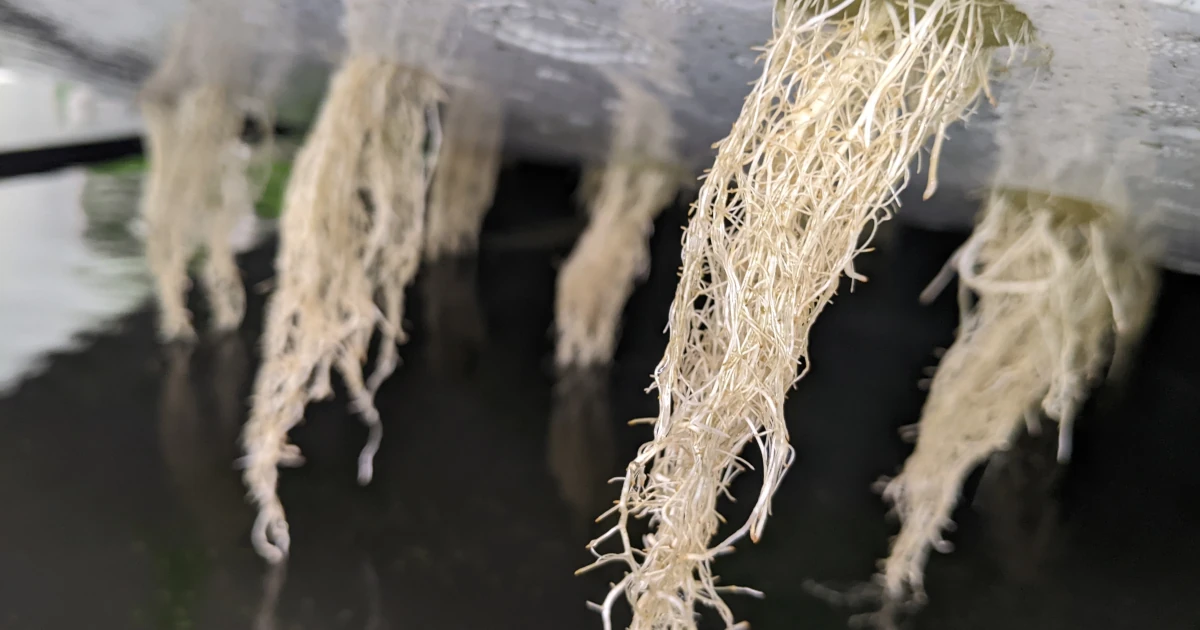
| Worsening root condition | Browning, softening, or dieback at the root tips |
| Onset of disease | Root rot or leaf disease increases |
The drift in the contents piles up over time. So deciding “when to remake it,” and remaking it ahead of schedule when the signs above appear——these two tiers are themselves the measure that protects the marketable yield. If you go a step further into reassembling the breakdown itself with straight fertilizer, the story changes, but to start with, renewal interval and signs are enough. Rather than doubting EC, recognize that there is a question EC will not answer for you, and pass that question to a different measure. Framing it that way is the right move.
Translating a broken nutrient solution into the language of gross margin
By this point a picture has come into view: EC, pH, and DO are not numbers you hit with the meter every day, write in the daily report, and call done; they are numbers that bite into how the harvest comes out, later. Which raises the next wall. How do you explain this feel to someone? Whether you are doing the nutrient solution right is hard to see from the management side. Asked “that nutrient solution management, how much is it doing for the profit in the end?”, you have all the logs but cannot translate them into the language of money, and you fall silent. The numbers on the floor and the figures management is watching must be connected somewhere, and yet that connection has never been put into words.
The circuit that translates nutrient solution management into money can be put into words once you split it into three tiers. The first tier is the on-the-floor causation: the nutrient solution numbers bite into the marketable yield. When DO leaks away, the EC and pH adjustments lose their bite, the drift in the breakdown piles up through recirculation, and that shows up as poor growth weeks later. The management side does not need this explained in detail. It is enough to hand it over folded into one sentence: “a broken nutrient solution shows up late, in the harvest weeks later rather than that day.” The second tier is where that marketable yield turns into volume and grade. What management watches is the volume that could be shipped, and the unit price by grade. The marketable yield dropping shows up as one of two things: the number of plants you set is the same, yet the shippable volume falls, or the grade drops a notch. This is where the floor numbers connect to money for the first time. If you can replace “there was a week DO leaked away” with “in the lot starting that week, shipment volume fell by such-and-such percent, and grade A dropped to grade B,” half of it is already in the language of money. The third tier turns it into a difference in gross margin. Even when the marketable yield comes in low, the fixed-cost side——equipment, labor, utilities——barely moves. So the more fixed-cost-heavy a facility is, the more a difference in marketable yield remains, in large part, directly as a difference in gross margin. Though when it comes in low, part of the variable costs——harvest, packing, sorting——drops in step too, so the difference in gross margin falls a little short of the difference in marketable yield. How wide it bites depends on the facility’s cost structure, but the direction is this: it is less a matter of increasing revenue than of not leaving already-paid costs on the table. The seed, the medium, the electricity, the people are all paid for up front, and at the final stage where you recover it as harvest, a broken nutrient solution shaves off that recovery. Place the same bite within the running cost as a whole, and you can see where in the cost structure nutrient solution management lands. So translating it for management goes over better said in this direction: not “do the nutrient solution and you make money,” but “when the nutrient solution breaks, you leave the recovery of already-paid costs on the table.” On top of that, as preparation for the problem of falling silent when asked, raise the way you log it by one tier. Separate from the daily numeric log, leave just a few lines per lot. What you leave: when that lot was planted and when it shipped, whether there was a week you judged it broke, what conditions you moved at that time, and how far the shipment volume and grade missed the expectation——four things or so, to start with, is enough. When you bring it to management, rather than showing the raw daily EC, pH, and DO log as-is, share a list at this granularity by week or by shipment lot, and the floor and management can look at the same column and talk. With that, you can later match it against the shipment record and trace it all the way to money: “the break that week led to this lot coming in X percent short.” The reason you cannot translate even though the logs are all there is that, while you have the numbers, no line has been drawn connecting “the week that broke” to “the shipment result.” Drawing that one line——that is what the bridge really is.
The range to pin down with the nutrient solution and the range to hand off to other factors
Here let me drive in a nail so we do not get carried away and overshoot. The way the story has gone, you might read it as: pin down the nutrient solution and the gross margin comes back. But in reality, the nutrient solution is not the only thing that bites into yield. Temperature, light, and CO2 bite too. For instance, how CO2 and HVAC bite can also be read as a path that connects floor numbers to harvest the same way. The nutrient solution is just one strand within that, and it is not so single-track that raising EC obediently increases yield, either. So when we say “read the nutrient solution as an operations KPI,” you need a line: how far is it a matter to pin down with the nutrient solution, and from where is it a matter to hand off to other factors?
The range to pin down with the nutrient solution, and the range to hand off to other factors. This is easiest to see if you split it this way: the environment side mainly sets the ceiling, and the nutrient solution is the side that delivers the materials while raising and lowering that ceiling. That the upper limit on how much matter photosynthesis can make is set by light, temperature, and CO2 is the general understanding in cultivation physiology. The nutrient solution plays the role of delivering the materials there with neither shortage nor excess, so no matter how much you pin down the nutrient solution, you do not go above the ceiling that light and temperature set. The reason raising EC does not obediently increase yield is that you are piling on more materials where the materials are already enough and it is stopped at the ceiling. If anything, piling on too much hurts the roots through osmotic pressure and can even work to lower the ceiling itself. In other words, the nutrient solution is the side that protects the ceiling from being shaved down from below, while depending on how you pile it on, it can also turn into the side that raises and lowers the ceiling.
This is backed up repeatedly in research, too. To begin with, there is no single optimal EC that is “this number is correct.” For pakchoi, taking growth and quality together, it is around 1.8 to 2.4 dS/m; for basil, yield is maximized at 3.0 dS/m——the optimal range scatters by crop. (see 8, 9) And even within the same crop, the EC that maximizes yield and the EC that maximizes quality nutrients are offset. For basil, while yield was maximized on the high-EC side, quality nutrients such as phenolics were higher on the low-EC side. (see 9) It is not that pile it on and it grows; the optimal point moves depending on which you go after. Set these crop-by-crop optimal ranges as the starting point for your own crop, but in general it tends to land somewhere around EC 1.0 to 3.0 mS/cm depending on the crop, so for the lettuce family start from the lower end of that and decide it, in the end, from your own floor measurements.
So as a line on the floor, first split “is it hitting the ceiling now, or is it leaving things on the table below the ceiling?” If growth is rising as expected and you still want to lift yield, that is not a nutrient solution matter; it is a matter to hand off to light, temperature, and CO2. Conversely, when the ceiling looks high enough but growth is not reaching expectation, and on top of that the trouble shows up late, it is the nutrient solution’s turn——time to suspect the DO and the drift in the breakdown described so far. There are also symptoms like tipburn that the nutrient solution alone cannot fully explain and that should be read in concert with other environmental factors. Frame it that way, and reading the nutrient solution as an operations KPI is not “a KPI for increasing yield” but a KPI for watching whether “the break in the nutrient solution is shaving down the ceiling that other factors set.” Less a strand for attack than a strand for stopping the leakage. The ceiling is mainly set by other factors; what keeps it from being shaved down from below is the nutrient solution. Think in terms of this division of labor, and your judgment of how far to pin down yourself and from where to let go does not waver.
Read this week’s log with a different eye
At first, many of you may have thought: I hit EC and pH carefully every day, so I am doing it right. But what you were hitting was the “easy-to-hit numbers,” and the crucial part——whether it is biting——you had barely watched at all; the way you read the numbers changes from the moment you notice that.
What you can do starting today can be small. First, take this week’s log and look it over with a different eye. Look back not at whether the numbers stayed within the normal range, but with this view: was there a week that broke, and what was moving on the condition side at that time? On top of that, pick just one place to put a hand in. The place that seems to be leaking the most——it might be DO, or it might be the drift in the breakdown. Put a hand in there and start drawing the line that connects the week that broke to the shipment result. If you try to do all of it at once, you slip back into the easy-to-measure things again. So drawing just one line is enough. Once you get used to it, connecting these logs to building a system that reads them as data makes that line sharper still.
EC, pH, and DO are not numbers you hit on the floor and call done. How you hit them works through the marketable yield weeks later, and shows up in how the gross margin comes out. There are plenty of operations where just hitting the targets is nearly enough, but when trouble shows up that the targets cannot explain, its true identity is usually one of three: DO, the drift in the breakdown, or the bite that shows up late. The one line you draw today is the first step toward reading that ahead.