Farm Operations Management
Humidity control in a vertical farm: why the same 60% dries differently
Articles for Farm Operations Managers
The hygrometer reads 60%, yet the stand is in different shape from one day to the next. The number hasn’t moved, and yet. Let me give away the trick: that 60% on the hygrometer is a ratio whose contents shift with temperature, and what the stand actually feels runs on a different axis entirely.
Why the same 60% isn’t the same 60%
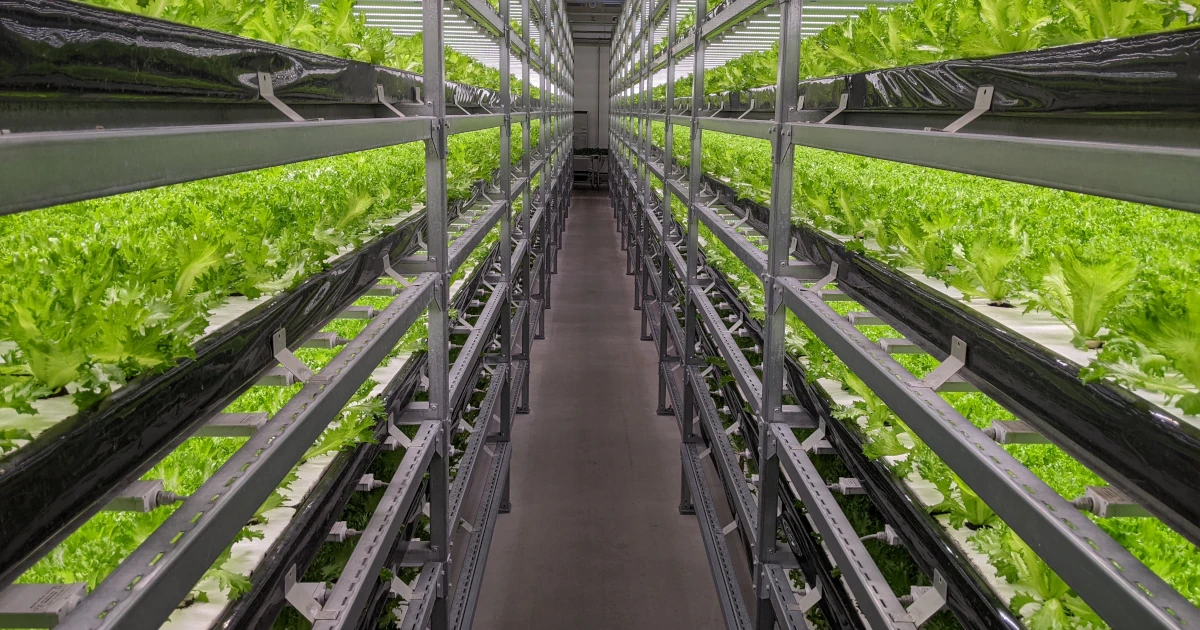
In a PFAL vertical farm, you hold the room temperature roughly constant and keep the moisture rising off the hydroponics suppressed by running dehumidification the whole time — that’s how a lot of operations run, I think. Humidity you manage as a range, like “target 60%,” and as long as the hygrometer sits around there, well, it’s probably fine. And in practice that runs without trouble most of the time.
But haven’t you had this experience? At the same “60%,” the stand looks somehow different from day to day. Some days the leaves have snap, some days not so much. The hygrometer number hasn’t moved, and yet. Looking back, you notice that on the good days the room temperature happened to be a touch higher than usual, and on a “60% but the stand feels sluggish today” day the temperature had dropped — that kind of pattern faintly comes into view. If so, then watching only the humidity number is missing something. If the same 60% isn’t the same 60%, then what exactly have I been watching to manage this?
That nagging feeling is probably not your imagination. Here’s the trick: the “60%” on the hygrometer is a ratio — at that temperature, of how much water the air can hold, how much is filled right now. Because it’s a ratio, when the temperature moves, the air’s “remaining capacity to take on more” itself changes even at the same 60%. Warm air can hold a lot, so at 60% there’s still plenty of room left to draw. When the room temperature drops, the full-tank amount itself shrinks, so at the same 60% there’s little room left to draw.
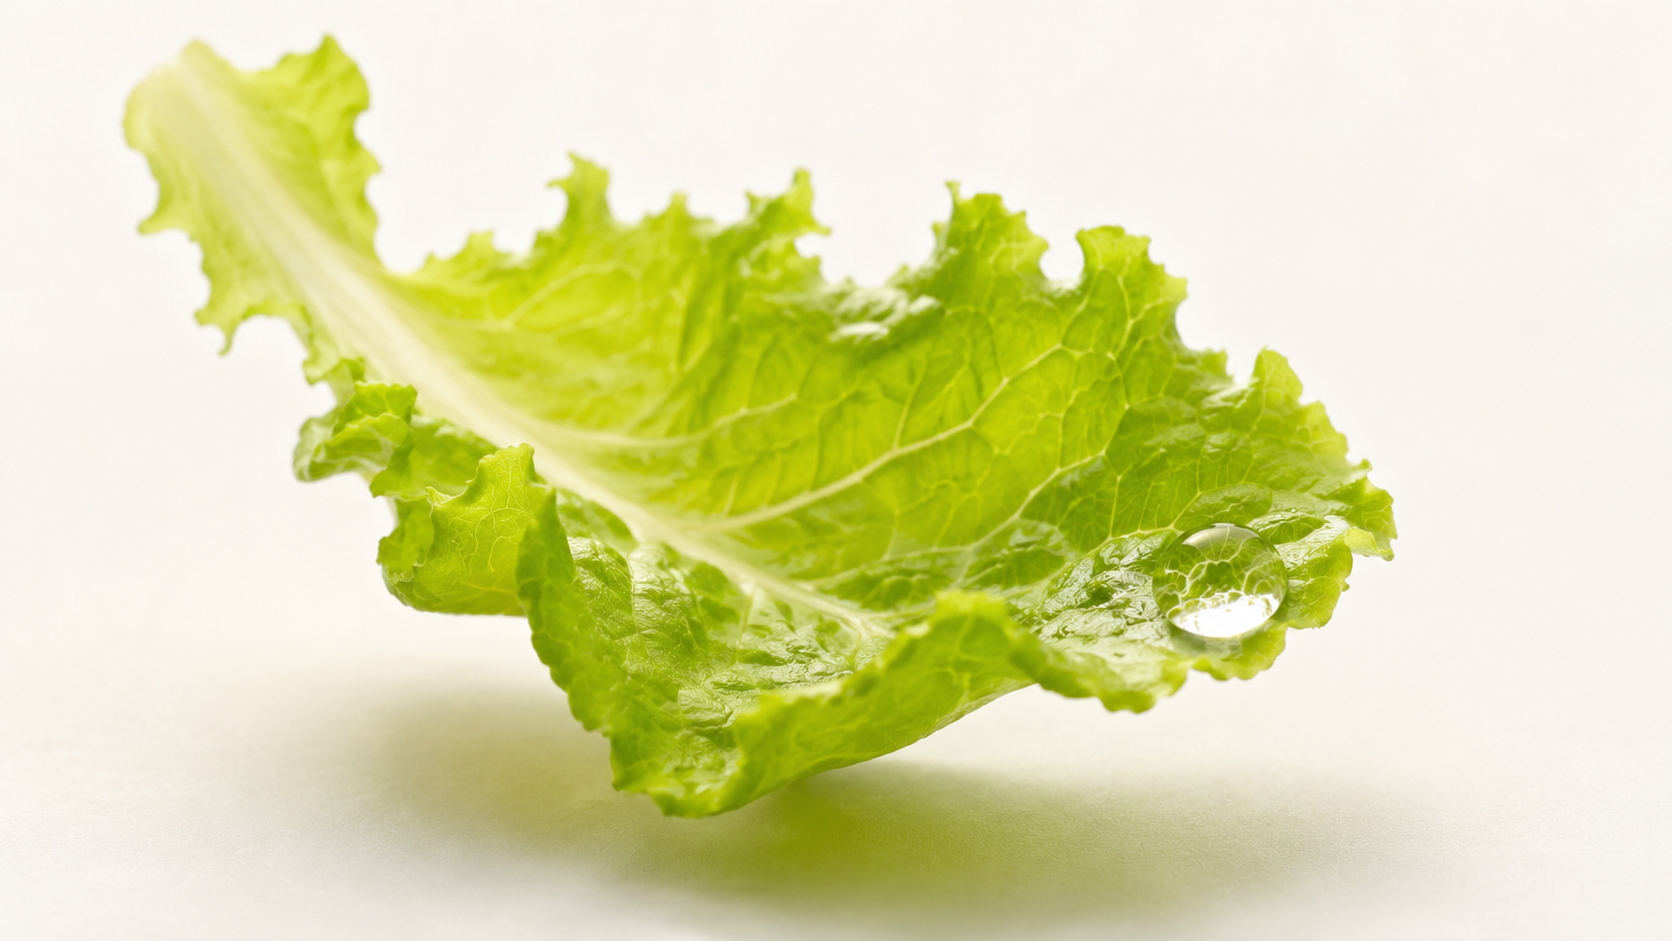
From the leaf’s point of view, this “room the air still has to take on more” is the very pull that lets it push water out as transpiration. This is what’s called VPD (vapor pressure deficit). The reason the stand looked good on warmer days is, most likely, that the air’s pull was working, transpiration was turning over, and riding that flow, water carried nutrients all the way to the leaf tips. On a “60% but sluggish” day, the temperature had dropped and the pull weakened — the leaf strained to push water out but couldn’t move all of it, and its insides were a little congested. That reading roughly adds up.
So what was I watching to manage things? I thought I was watching the hygrometer, but what was really at work — paired up with temperature behind it — was the pull of transpiration. The number 60% is one cross-section of a result, and it’s a different thing from the continuous axis the stand was feeling. That sense of “the same 60% isn’t the same 60%” is hitting the very core.
Here let me honestly draw a line. What I’ve seen on the floor is only PFAL leafy greens, so what I can say goes as far as “read temperature and humidity as a set, and the scene changes.” Exactly which VPD to run at for the best result will differ by crop and growth stage, and that’s not something I myself can yet state with certainty.
This reading — “because it’s a ratio, the contents change with temperature” — is said in the same direction in research too. Humidity itself — relative humidity or VPD — is a regulating factor that reaches all the way into how far the stomata open, the amount of transpiration, how minerals are taken up, and even photosynthesis. It’s framed not as a background condition but as something on the side that moves the stand’s internals. And what’s interesting is that it isn’t a simple “raise the humidity and it takes up, lower it and it takes up”; the reports go as far as saying that which way it ultimately tips changes with the crop species and the combination with temperature (ref: 1, 2). That’s exactly why that nagging feeling of “watching only the number misses something” is, I think, fairly close to the core.
Dehumidification and room temperature move one pull from different sides
Once it clicks that “because it’s a ratio, the contents change with temperature,” the next nagging feeling probably comes up like this. I’ve worked all along on the premise of holding the room temperature constant, but by this account it was temperature that was on the side deciding the pull. So then, managing those two — “room temperature constant, humidity 60%” — as separate knobs in the first place may itself have been slightly off.
It’s not that I want to move the temperature. But if the aim is that “pull,” which knob am I usually turning, and for what? Strengthening dehumidification versus touching the room temperature — from the stand’s point of view, are they doing the same thing or different things? That suddenly becomes unclear.
To put something like a conclusion up front: from the stand’s point of view, dehumidification and room temperature aren’t two separate things — they’re probably moving the same single axis (that “pull”) from different sides. Lower the humidity or raise the temperature, and the air’s “room to take more” widens. From the leaf’s side, either operation moves things in the direction of strengthening the pull. The reverse holds too. So what looked like two knobs was actually merging into one quantity — that’s the view.
But merging doesn’t mean the two are interchangeable. This is the interesting part. Temperature moves not only the pull but the stand’s metabolism itself — the speed of growth, respiration — along with it. So if you turn temperature for the sake of the pull, it drags other things you weren’t aiming at along with it. Dehumidification, by comparison, can touch the pull alone without disturbing those. They act on the same axis, but the range they pull in is different. This sense of temperature moving the pull and metabolism at the same time leads into the discussion of redesigning temperature itself from physiology.
So to the question “which am I turning, and for what,” I can say this. If the aim is the single point of the pull, normally go and match it with dehumidification, which doesn’t drag extras along, and leave temperature as the final margin for moving the pull. Holding the room temperature constant was probably not a mistake in itself. If anything was off, it was seeing temperature and humidity as two unrelated things, when really they were deciding a single pull from two directions.
One caveat: what I’ve verified firsthand is only the range of PFAL leafy greens. The broad outline — that dehumidification and temperature act on this one axis — has clicked for me there, but how much of each it pays to move will surely vary a fair amount with crop and the quirks of the equipment, and that’s not something I can state with certainty.
When you actually move the pull, the stand’s internals change too. This becomes a greenhouse tomato story, but it shows up clearly in experiments as well. Lower the air’s pull — that is, the VPD — from around 1.4 down to about 0.8 kilopascals, and stomatal opening and photosynthesis increased, and yield rose by a little over ten percent — about 12% — according to one report (ref: 3). The crop and the equipment differ from leafy-green PFAL, so this isn’t a number to carry straight into your own floor. But the broad outline — “the pull is an axis the stand answers to properly when you go and match it” — comes into view here too. It backs up the view that while you thought you were holding the hygrometer’s %, you were really touching this pull.
The pull can be read off the wall’s two numbers; what’s missing is the place
Once the single axis of pull comes into view, the question at the floor’s hands naturally becomes this. That pull — the VPD — is it something you can’t see without installing some new instrument? Or is it already within reach with just the thermometer and hygrometer already hanging on the wall?
Bottom line first: with the thermometer and hygrometer on the wall, the pull itself is already within reach. VPD is a quantity fixed by temperature and humidity, so rather than a new instrument, it’s the kind of thing where you just re-read the two numbers you already hold not as a “ratio” but as a “pull.” Whether you look it up on a quick-reference chart or compute it from the conversion formula, the pull value that comes out is the same. So it’s not a story of not having the machine to measure it.
If anything is missing, it’s probably “where” the pull is. The thermometer and hygrometer on the wall are usually measuring the room’s air. But that pull was about the pull the stand — or rather the leaf — feels. So then, can a number measured around the middle of the room be taken as the same as what’s happening right next to the leaf? Especially as stands stand packed and the leaves grow dense, the air inside that thicket feels different from outside. Put your hand in and it’s a bit stuffy. Can the middle-of-the-room number really stand in for the pull in a spot like that? That’s the nagging point.
This is truly so. A number measured at the middle of the room is, at best, the room’s representative value. Inside a thicket where the leaves have grown dense and the air has gone stuffy, the moisture clears more slowly than outside, and the pull has weakened. That sense of sluggishness when you put your hand in is probably information you mustn’t leave out. Strong-pull spots and weak-pull spots coexist in the same room. One point in the room is just looking at the average of those, and it’s slightly off from the pull the stand actually feels. This spot-by-spot unevenness, pushed to its end, arrives at the discussion of redesigning airflow and HVAC from the equipment side.
So the image for how to measure is, before adding instruments, first to go in suspecting “where is the pull likely weakest” — that’s the order, I think. Inside the thicket, the deep recesses where the air moves least. How far that spot lags the room’s representative value — once you’ve grasped that, then when you look at the wall’s number you can read it with a deduction: “the middle is this, but the back should be a bit weaker.”
But here too let me draw a line: what I’ve confirmed with my own hands goes up to PFAL leafy greens, and the sense of the thicket’s interior going stuffy is within that range too. How far off it gets, and how effectively scattering it with air works, will surely vary a fair amount with plant spacing and flow rate and the equipment’s quirks, and that’s not something I can state with certainty.
The two numbers on the wall put the pull itself within reach; what’s missing is the reading of what’s pulling transpiration — this framing has backing from the research side too. There’s a study on greenhouse eggplant looking at what most decides the speed of transpiration. At a glance it looks most correlated with solar radiation, but when you subtract out the other factors and extract only the pure effect, the effect of the air’s pull — the VPD — came out at 0.84 and the effect of solar radiation at 0.47, so the pull was nearly twice as strong. The reading is that much of the apparent correlation with solar radiation was actually indirect, mediated by the pull (ref: 4). It’s a greenhouse-eggplant story, so it’s not a number to apply straight to leafy-green PFAL, but the direction — “if you read irrigation and condition by solar radiation alone you’ll drop things; look at the pull” — overlaps well with this.
Is the tip dying from a clog or from losing the relay?
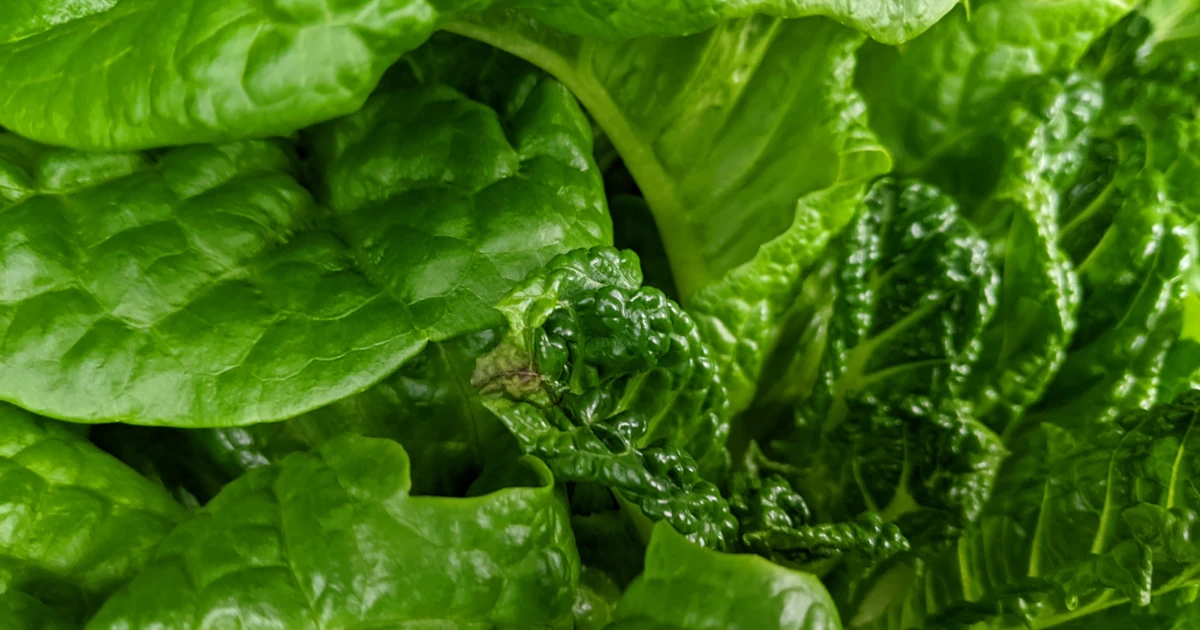
The story that the back of the thicket has a weak pull connects to how symptoms show up too. The first humidity-related trouble that catches your eye on the floor is, I think, what many picture as tipburn — leaf tips scorching brittle. And it’s not the old lower leaves but the tips of the newest, most vigorously growing leaves that get hit. That the vigorous leaves get hit has long been a puzzle.
Here, thinking it over after hearing the pull story, a snag comes up. If the flow is “weak pull means transpiration doesn’t turn over, so nutrients don’t arrive,” then it feels like tipburn ought to show up where the pull is weak — that stuffy back of the thicket. But, wait a moment. If the pull is too strong, can’t it also happen that the leaf pushes out too much water and water doesn’t make it to the tip? If so, the tip dies whether the pull is weak or strong, and looking at the symptom alone you can’t tell which side it is.
That concern is exactly right: tipburn shows up whether the pull is weak or strong. So from the look of the symptom alone — the tips of new leaves going brittle — you can’t tell which side it got hit from. Your point holds here.
But even for the same “tip dying,” what’s happening inside the leaf is the front and back of the same coin. The true nature of tipburn is, in short, calcium not reaching the leaf tip. Calcium is carried riding the transpiration flow, and once it arrives it’s a stay-put nutrient that won’t move from where it landed, so at the growing new leaf tip — the farthest place that wants it most — the shortfall shows up first. The puzzle of the more vigorous leaf getting hit is probably here. Because the demand is the largest.
With that in mind, the two sides split like this. On the weak-pull side — that stuffy back of the thicket — the flow itself doesn’t arise, so it can’t carry. It’s congestion with the exit closed. On the too-strong-pull side, the whole leaf is pushing out water furiously, but the speed of growth is faster, and the body uses it up before the flow reaches all the way to the tip, the far end. There’s flow, yet the far end gets left behind — losing the relay, you might say. The result of not arriving is the same, but whether it’s clogged or losing the relay, the cause is the opposite.
So which was mine? When I size things up on the floor, what I look at is less the symptom itself than “where it appeared” and “which direction the pull was facing at the time.” If it appears in a deep recessed row where the air goes stuffy, and on a day when the whole place feels sluggish, I suspect the weak side. Conversely, if it appears in a spot that catches wind and tends to dry, during a period of fast growth, I suspect the strong side, losing the relay. The symptom wears the same face, but read together the spot where it appeared and which direction the pull was facing, and it roughly adds up. If tipburn still shows up after you’ve matched VPD to a proper place, you move on to coupled factors beyond the pull — and from there, the discussion tracing tipburn’s coupled factors takes over.
And since this is a story about how it’s distributed, another important point is that just making the calcium in the nutrient solution stronger won’t easily reach the young leaves on the inside. More than total amount, it’s the delivering flow that works. That said, there are supply-side measures too, like spraying directly onto the leaves, and it’s worth holding that as an option alongside moving the pull.
To add just in case: what I’ve felt on the floor myself is only the range of PFAL leafy greens, and even my way of sizing it up is a rule of thumb. The boundary of which pull tips the tip to which side will surely shift a fair amount with crop, the vigor of growth, plant spacing, and flow rate, and that’s not something I can state in numbers with certainty.
Calcium is carried riding the transpiration flow; more than total amount, it’s the delivering flow — a hydroponic lettuce experiment shows this view in almost exactly that form. Make the light stronger to push the stand into fast growth, and across the whole stand both calcium uptake and the concentration in the outer leaves rise, but the calcium of the young leaves wrapped inside alone won’t increase. The reason: the flow carried by transpiration skews toward the outer leaves where transpiration is vigorous, and doesn’t reach the inner leaves where the pull is weak. So it meshes with the puzzle of “the shortfall shows up first at the vigorously growing new inner leaf tip.” And here is exactly the thing: just making the calcium in the nutrient solution stronger doesn’t dissolve this failure to reach the inner leaves. The line comes out clearly that it’s not a problem of total amount but a problem of distribution (ref: 5, 6).
And, one mechanism deeper, the transpiration flow itself pulls how ions are taken up from the roots — this too is shown in hydroponic experiments. The thread is that environment — light, temperature, humidity — moves even root uptake by way of transpiration (ref: 7). It’s not to the point of stating transpiration is the only driving force, but it puts backing, from the root, under the single thread that “pull makes the flow, and that flow carries the nutrients.” When transpiration drops, nutrient-solution uptake drops — and if so, this runs straight into the discussion of re-reading from the nutrient-solution KPI side too.
Before easing off dehumidification, shave down the unevenness in the pull
Going after the direction of the pull from how symptoms show up is very practical. Here let me shift the angle a little and set down the scene as seen from the management side too. The floor manager is also in the position of being asked about dehumidification’s electricity bill come summer. “The dehumidification electricity bill — can’t this be brought down?” The direction of weakening the pull — leaning toward raising the humidity — could cut dehumidification, but there’s fear in that.
I’ve said “no, this is necessary” on floor instinct alone, but not with numbers to back it up. It also feels like keeping humidity at 60% had become an end in itself. In that state, what happens when you think it through in light of the pull story? Easing off dehumidification to raise the humidity is, from the stand’s point of view, swinging toward weakening the pull. If so, then that “back of the thicket” — the spot that was already the weakest in pull and stuffiest — will probably tip to the clogged side first. Even if you look at the whole room on average and think “still in the 60s, it’s fine,” the weakest spot may already have crossed its limit — that’s what seems likely to happen, and that’s the fear.
That fear is on the mark. Ease off the whole room uniformly, and what cries out first isn’t the room as a whole but the weakest spot — that stuffy back row of the thicket. So the reading that “the ceiling is decided by the weakest spot” is correct. That it looks like there’s still margin on average while the back has already tipped to the clogged side is the most common way to get it wrong on the floor.
But stepping back a notch there, the entry point isn’t only easing off dehumidification. What’s scary is that there’s a “weakest spot” at all — that is, that there’s unevenness of strong and weak pull within the room itself. If so, the first thing to put a hand to may be that unevenness rather than the amount you ease off. Scatter the stuffiness at the back with air, and bring the weak spot closer to the room average. Then the ceiling of the weakest spot rises, so margin opens up to ease off the whole a bit more at the same yield — that’s the order. Before how much to drop dehumidification, first suspect whether you can build a state where the pull reaches without leaning on dehumidification.
The cost of turning the air with a fan is usually lighter than dehumidification itself, so as an entry point that’s often the better-reasoned route — that’s my sense. Rather than easing off uniformly and getting a fright, shaving down the unevenness and then re-measuring the ceiling actually gets you a bigger drop in the end.
How to size up the dehumidifier’s own capacity also rides on this “line up effect and cost” flow. The dehumidification volume needed rests on how much water the plants push out day to day. Putting a single fixed number on it is hard — the actual needed volume moves a fair amount with plant spacing and how transpiration comes out — but as a way of thinking, look at it with capacity that gives a bit of margin over that assumed volume. With razor-thin capacity it pins at the summer peak and pushes the weakest spot to the clogged side first. With margin in the capacity it runs more stably, and easing-off judgments become easier too. If you find yourself wanting to re-measure this dehumidification energy load within a broader running-cost whole, the discussion of re-evaluating from total cost takes over the continuation. For those who want to once write out the floor’s cost line items properly and translate them into the language of management, I’ve also prepared [Free] 13 templates used in vertical farm operations management.
Here too, to be honest: what I’ve verified firsthand is only the range of PFAL leafy greens, and this “shave the unevenness first” is a rule of thumb as well. How much you can even things out with air, and how far you can drop by easing off, will surely vary a fair amount with the equipment’s quirks and plant spacing, and it’s not that I can state a specific drop in numbers with certainty.
That the question from management — “can’t the dehumidification electricity bill be brought down” — comes every year actually fits the reality of the load. In a study of the energy breakdown in a closed-type vertical farm close to PFAL, the load on dehumidification took up half — over 50% — of total energy demand, according to one report (ref: 8). Lighting and HVAC tend to catch the eye, but the more you raise airtightness and trap the moisture in, the more the dehumidification that draws it out should come to matter. So the floor instinct of saying “dehumidification is necessary” isn’t off the mark in numbers either. At the same time, precisely because it’s that heavy a line item, there’s value in pinning down “how far it can be eased off” rather than cutting it blindly.
The first move you can make tomorrow without adding a machine
Once the order of “shave the unevenness before easing off” clicks, let me set down one more boundary line. Toward weakening the pull there’s also a brake: it gets steamy and disease is more likely to show up. Once you cross that and disease starts circulating in earnest, it’s no longer a story to hold with the placement of humidity alone — it’s the scene to switch to a different measure. And the over-raising-humidity side is the entrance not only to disease but to legginess — stands growing spindly and stretched — so if you start to wonder whether excess humidity has become a leading indicator of legginess, you can check it in the discussion tracing legginess’s leading indicators.
On top of that, if there’s a first move someone who’s carried this story home can make tomorrow without bringing in a new machine, what would it be? For my part, I’d start by putting a hand into the spot where the pull is likely weakest.
No tools needed. Put your hand into the deep recessed row where the thicket is densest and the air seems stuffiest. Is it stuffy and sluggish compared to outside, or is the air moving properly? That alone, and you feel in your skin where the “weak spot” in your own room is. The thermometer and hygrometer on the wall only tell you the room average, so go find the spot left behind by that average with your own hand first. Along with that, work out the current VPD — the pull — from that temperature and humidity once, and “around where am I running right now” comes into view in numbers too.
Once you find it, next is air. Without bringing in a new machine, try changing the direction of the fans already running or how the stands are arranged a little, and see whether you can get air through to the back. If the stuffiness clears, the weakest spot’s pull moves closer to the room average and the unevenness shrinks. The story of how much to drop dehumidification can wait until after you’ve shaved that unevenness, I think.
In short, take one step past simply re-reading the numbers — and confirm by hand “where in my own house is the pull weakest.” That, I think, is the one move you can make tomorrow without adding a machine, and one that becomes the foundation for every judgment that follows.
One last thing, let me honestly draw a line. What I’ve confirmed with my own hands is only the range of PFAL leafy greens, and what I’ve talked about today is a read within that hands-on feel. Change the crop or the equipment, and how the weak spot shows up and how the air takes effect should change too. So take this move, too, not as an answer but as a first foothold for suspecting your own floor.
Next is air — getting it through to the back by the direction of the fans and the arrangement — and this move has backing in lettuce in a closed-type vertical farm. Apply a steady horizontal airflow of 0.28 meters per second or more along the grow bed, and tipburn’s appearance was suppressed, according to an experiment. And what’s interesting is that in the same experiment, operations that moved the temperature didn’t do much to suppress tipburn — that is, “moving the air with wind” worked better than “touching the temperature.” Further, applying steady wind narrowed the gap in calcium concentration between the inner and outer leaves — it’s visible down to that point (ref: 9). Scatter the stuffiness of the weak-pull spot with air and the flow circulates more easily even to the hardest-to-reach inner leaves — a result that overlaps directly with the present read. The caveat that how much you can even things out with air varies with plant spacing and equipment is fair too, and the airflow speed that worked is a value under this experiment’s conditions.
For those who want to look through the floor’s revenue-moving moves as a whole, not just electricity and humidity, see also 172 hints for raising the profitability of a vertical farm.